
Articles, code experiments and other non-work things.

A collection of front-end code experiments on CodePen and mainly focusing on CSS Grid.

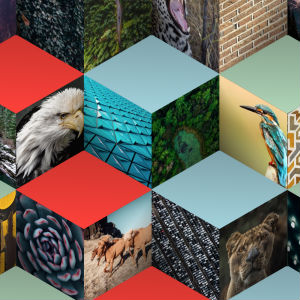
Using a repeating SVG background image on pseudo elements to create a layered background so that other elements can appear to be "poking up" between them.
Built on CodePen with the usual CSS Grid techniques I'd used in previous pens to make sure the design is responsive.
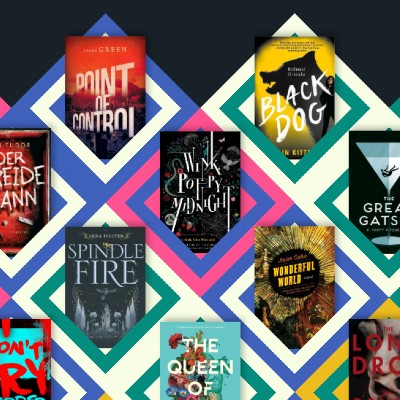
Another CSS Grid product layout. This time with books, clip-path, conic-gradient, shadows and hover effects.
Conic-gradient is used to create the 2 colour effect on the pseudo elements before and after the books. To ensure cross-browser compatibility I used the incredible Lea Verou's polyfill.
Colour palette inspiration from the always stunning Jay Fletcher.

An experiment expanding the height of a CSS Grid with the scroll of the page. The animation of the expanding and appearing elements is driven purely by the overall height attribute.
As the overall height changes, the order in which the grid rows expand depend on whether individual row heights are set using absolute pixel values, fractional units or minmax pixel values.

A "masonry" style eCommerce grid where the background, photo and product details/border sit on 3 different levels. The levels move with the mouse and align for a particular product as the user moves the mouse over it.
Uses the Tornis JavaScript library to track the scroll of the page and attributes of the page.

A responsive CSS Grid eCommerce layout showing sneakers from both sides. Mouse over effect rotates card and zooms in on product.

A layout of interlocking cards using skew and rotate on a CSS Grid to ensure a responsive display. A hover effect brings the selected product to the front and zooms in on the design.
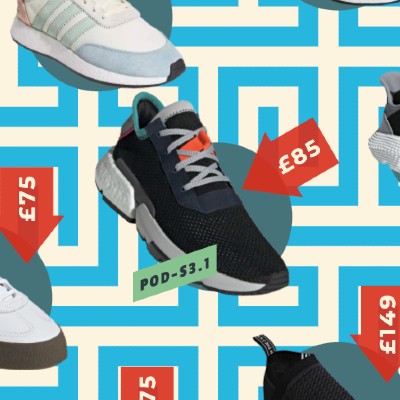
A skewed eCommerce layout using CSS Grid for responsive arangement of sneakers. Mouse over effect on product and details.

Responsive CSS Grid layout with tessellated background. Mouse over effect changes background colour and zooms product.
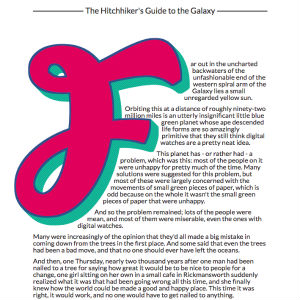
Dynamically generated large "drop caps" using "shape-outside" to wrap text round a large first letter.
The first letter of the text is hidden and a large image version created using the path definition from the svg font file. This allows the letter, font and sizing and placement of the drop cap to all be generated dynamically. I also added a choice of SVG filter effects that can be added to the first letter.

Builds on some of my previous examples with isometric CSS Grids to make an eCommerce product grid with a 3D effect. The products have a smalll hover effect on mouse over.
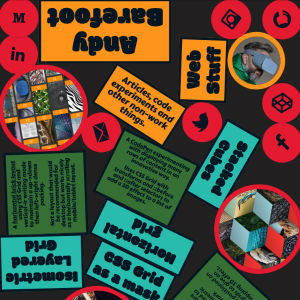
Just a fun project playing around with the matter.js library to make an animated layout that looks like that draw in your kitchen with all those things you haven"t thrown away because they will be useful one day.
Daniel Shiffman's excellent video tutorials got me started.
A CodePen experimenting with displaying many rows of content in an innovative way.
Uses CSS Grid with transforms and ::before and ::after selectors to add a 3D effect to a list of images.
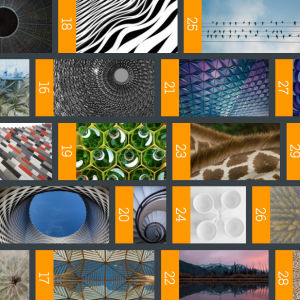
A horizontal brick layout using CSS Grid and vertical-lr writing mode to maintain a up->down then left->right dense packing.
Not a layout that would be recommended for desktop but works nicely as a horizontally scrolling mobile/tablet layout.
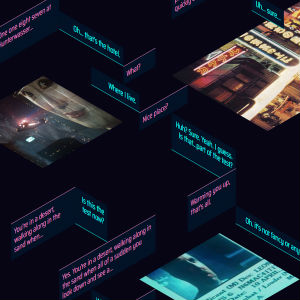
An experiment in overlaying CSS Grids to create an isometric layout. Three grids are skewed and rotated to provide an isometric framework
Content is positioned on the 3 grids to give an overlapping 3D effect.

A CodePen that uses CSS Grid as a mask to recreate a design similar to this poster.
The grid contains many "filler" elements that only exist to obscure the background image from view.
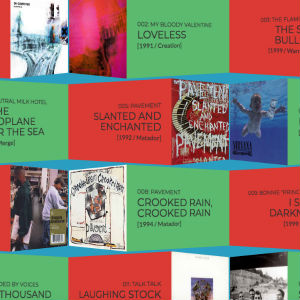
A CSS Grid layout using perspective and Y-rotation to give a 3D effect.
JavaScript is used to make sure the item styling alternates correctly as the number of items on each row changes.

A morphing grid experiment using CSS Grid to provide the grid and dynamically changing the "grid-template-columns" and "grid-template-rows" attributes based on the mouse position.
Based on a Flash experiment by Yugo Nakamura
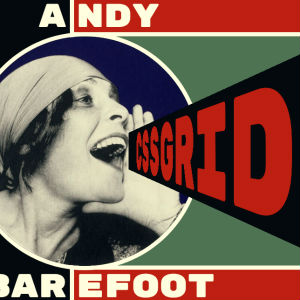
A CSS Grid layout experiment on CodePen using CSS Grid and CSS transformations and perspective.
The layout is based on the famous 1924 poster by Alexander Rodchenko for the Gosizdat publishing house.
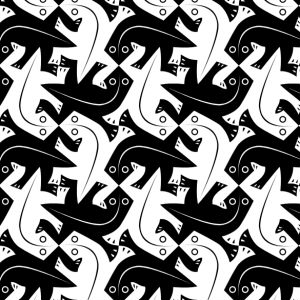
An experiment on CodePen combining CSS Grid and SVG animation using D3.js.
The tessellated lizard tiles are based on a painting by M. C. Escher.
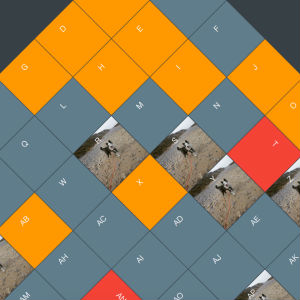
A CSS Grid layout on CodePen with a diagonal grid that fills exactly the browser window and orders the items appropriately.
The user can specify the total number of grid items and the number of items per row. JavaScript is used to resize the grid and place the items in the correct order.
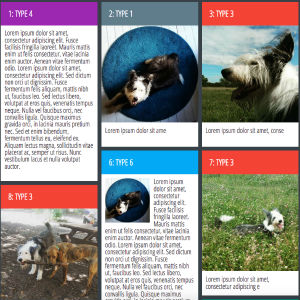
CSS Grid makes laying out content in a grid much easier and does a good job of Masonry style layouts as long as you are able to specify the size of each grid item in advance.
I wrote an example of how you can use a little bit of JavaScript to automatically resize the grid items to get a perfect Masonry layout with CSS Grid.
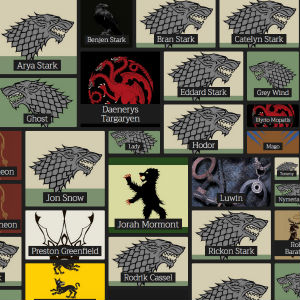
The dilligent and learned maesters at the excellent Game of Thrones wiki have documented everything you could ever need to know about Game of Thrones. This includes every character who has appeared in the show. From Daenerys Tagaryen to Othell Yarwyck to "Dwarf Hunter 2". If they speak a line or even if they are just an interesting corpse they will be on the site.
I used this data as the basis for an experiment using CSS Grid to create a grid whose elements expand to show more content when clicked.
The grid was built using D3.js to load in the data and populate the grid with content.
Front-end coding posts on Medium or CodePen.
Having spent a few months experimenting with CSS Grid layout I had a collection of CodePens that I thought were interesting and demonstrated techniques I hadn't seen elsewhere.
With this in mind I wrote a Medium post listing some of these new techniques and layouts and included links to the CodePen examples.
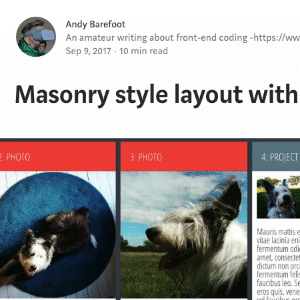
A commonly asked question about CSS Grid is whether it can support a Masonry-style layout. The short answer is that it can't. However it has a lot of features that make creating a Masonry-style layout easier if you use a small amount of JavaScript and are willing to accept some minor limitations.
I wrote a post on Medium explaining this approach and providing examples of various iterations of the final solution.
I had created an example on CodePen of how to lay out content in an Isometric display using CSS Grid.
Responding to a tweet by Rachel Smith I wrote a CodePen post describing how I had created the isometric grid layout and how to place content within it.
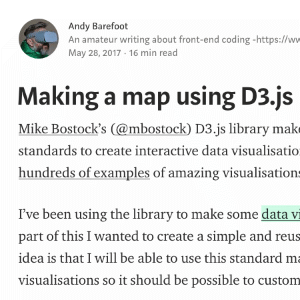
Having started using CSS Grid I was interested in exploring its ability to lay out different size content blocks into a densely packed grid. For this I used all the characters from Game of Thrones that I had gathered for a data vis project.
I then wanted to extend the functionality so that clicking on one of the grid elements would expand it to reveal more content without the element moving position within the grid. This article explains how this was achieved using the CSS Grid layout and JavaScript.
Mike Bostock's D3.js library makes use of SVG, HTML5 and CSS standards to create interactive data visualisations for the web. He has hundreds of examples of amazing visualisations created using this library.
I had been using the library to make some data visualisations of my own and as part of this I wanted to create a simple and reusable world map template. The idea was that I would be able to use this standard map as a base for future visualisations so it should be possible to customise it very easily.
This article describes the approach I used and all the information necessary for someone to customise it. The article links to the completed map on CodePen.

An old article describing how I added my latest Instagram photos to my personal site using my own look and feel despite Instagram not really supporting this.
Article describes scraping Instagram for my most recent content, saving the images locally and then implementing a Masonry layout using AngularJS
The implementation it describes is no longer live, but the approach should still work.
Data Vis experiments mainly using D3.js.
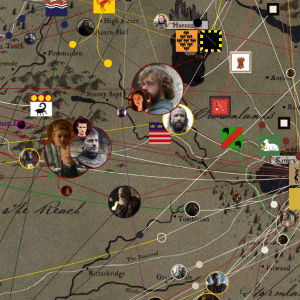
To play the Game of Thrones you will need allies. But when those allies are Petyr Baelish, Roose Bolton or Alliser Thorne you will also need stab proof armour.
This map shows all the major houses and institutions of the Game of Thrones world with the many, many allegiances and connections to the hundreds of characters in the show.
The visualisation was built using D3.js using data from the excellent Game of Thrones wiki.
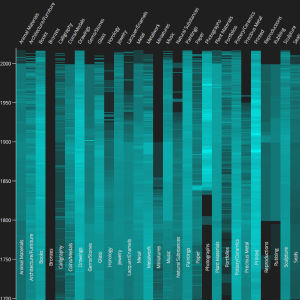
The Metropolitan Museum of Art recently published to GitHub the details of 446,029 objects from their collection.
This data visualisation attempts to show the distribution of the entire collection by date and to show the difference in age depending on the type of artefact. For example, the majority of vases in the collection are from around the year 300 A.D or before.
The visualisation was made using D3.js after the raw data had been consolidated into JSON using PHP.
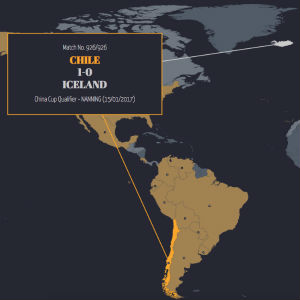
Following on from my previous UFWC data visualisation I wanted to show the progress of the Unofficial World Football Championship using an animated interactive map.
The animation shows details of all 926 matches played so far as the map updates to show which teams have held or challenged for the title.
The visualisation was built using D3.js and JQuery and all the game data was sourced from the UFWC website.
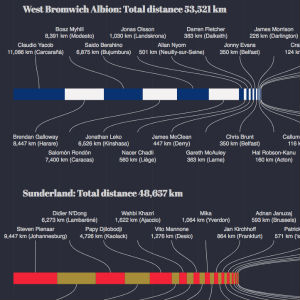
A data visualisation to show the distance travelled by each Premier League footballer to get to their current club. It shows the distance from the player's birthplace and the clubs they have been at along the way both individually and totalled for each club.
See which clubs cast their nets the furthest and which rely on the largest number of journeymen.
The visualisation was built using D3.js and JQuery and all the data was scraped from Wikipedia.
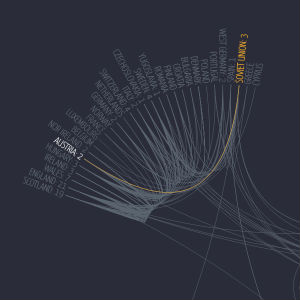
The Unofficial Football World Championships is a project by Paul Brown that tracks the World Champions of football as if the title were decided in the same way as boxing, i.e a team remains champions until they lose a game.
My data visualisation shows all of the 918 "title decider" games that have been played so far showing how the title has jumped from nation to nation and continent to continent.
The visualisation was built using D3.js and JQuery and all the data was sourced from the UFWC website.
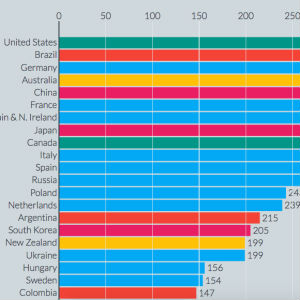
A selection of data visualisations from the 2016 Summer Olympics.
Data was either manually collected from wikipedia or scraped in real time from the BBC medal table and then stored in MySQL and formatted to CSV or JSON files.
The visualisations were built using D3.js and JQuery using some of Mike Bostock's excellent examples as a starting point.
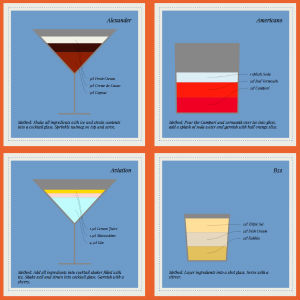
An exercise in using D3.js and SVG to create data visualisations of cocktails and their ingredients.
Inspired by this original visualisation by Tatjana Dubovina & David McCandless I wanted to make an entirely dynamically generated version.
The data was taken from Wikipedia and is served in JSON from a MySQL database.
Each visualisation is generated programmatically from the data, including the drawing of the glass outline to create a menu of over 70 cocktails.
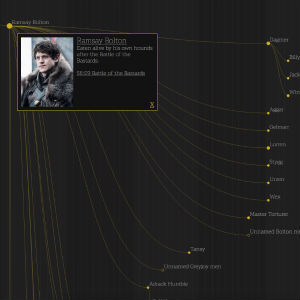
Fans of Game of Thrones know that Valar Morghulis (all men must die) but when over 200 named characters have already gone to meet The Seven (or The Old Gods, or The Drowned God, or The Lord of Light, or The Many-Faced God of Death, or the Great Stallion, etc...) then it gets hard to keep track of the tragedy.
Fortunately Maester Barefoot has created a comprehensive record of all these deaths, whether violent, very violent or extremely violent.
Valar Morghulis shows every death and who was responsibly for the slaying. A kind of "butchery tree" if you like.
The data was scraped from the excellent Game of Thrones wiki and the data representation is implemented using Mike Bostock's marvellous D3 library.
Mobile game development using the Unity platform.
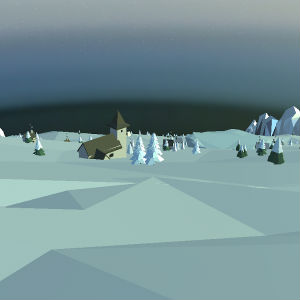
Ski VR is a quick VR demo built for Google Cardboard but also playable without a headset.
Slide gracefully down the mountain between trees and alpine chalets in a Virtual Reality winter wonderland.
Ski VR was built in Unity with the Google Cardboard SDK and uses 3rd party graphical assets.

Color Hex is a mobile puzzle game for Android and iOS built and published uing the Unity platform.
The player must try and match patterns by mixing colours together on a hexagonal grid. As the patterns get more complicated the puzzle becomes more difficult.
There are 2 play modes with a combined total of 222 levels.
Color Hex was built in Unity which supports exporting to both iOS and Android platforms.
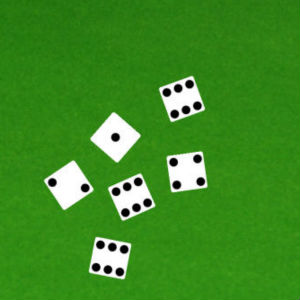
My first attempt at using the Unity platform to create a mobile game was a mobile version of the dice game Farkle.
The game can be downloaded from the Google Play store or played in browser.
Some web sites used for experimenting with various technologies.
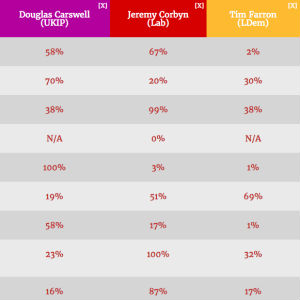
The site the Public Whip aggregates the data on how MPs in the UK parliament vote. They then group this by similar votes to provide an insight into how much each MP supports a particular policy.
The site did not provide a tool to enable users to easily compare MPs and see their relative support for each issue.
I made a small site that scrapes the data from the Public Whip and allowed the user to compare support for related policies across groups of MPs. The tool also allowed the user to select any policy or MP and add them to the comparison.

Demo search engine of sneakers collating and comparing sneakers from a number of eCommerce sites.
Regularly spiders a number of sites and compares prices where identical sneakers appear on multiple sites.
The spiders and APIs are built in PHP, the database in MySql and the front-end uses SASS for the CSS.
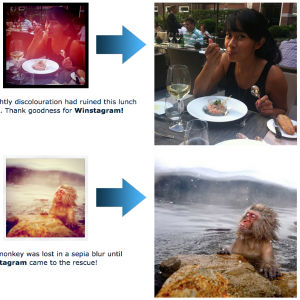
More and more people are posting photos on their social web blogs. But most of them are not very good photographers. Or have poorly made cameras. The colours come out funny, the edges are all crackly and often some of the image is out of focus.
I have developed an app to restore these poor quality photographs: Winstagram!

Good old David Cameron. He's so suave yet so caring. he just wants the best for the country. He says so in his lovely new poster campaign (NSFDuring lunch).
Deface David's poster with your own words with "Make your own David Cameron poster".
Go on, have a go. You know you want to. Make it look like he is saying rude words. Hurr hurr hurr!
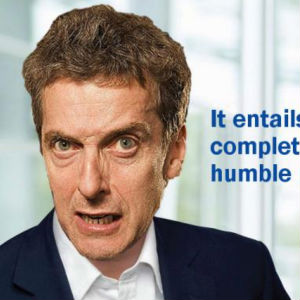
Combines the David Cameron poster generator with the foul-mouthed tirades of Malcolm Tucker, sweary spin doctor from The Thick of It.
A random choice of blue bon-mot is substituted every time you click the "Tuckerise" button so click away. However, be warned. He is a very very rude man and if you don't like naughty words you probably won't like this.
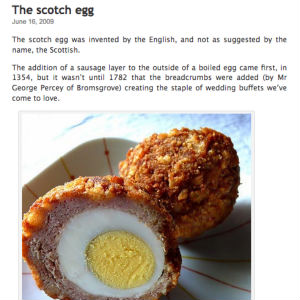
If it was invented, it was probably invented by an Englishman.
A retired blog detailing all the greatest inventions of the English.